According to this morning's release of October Chicago PMI, the index edged up 0.2, but remained below 50.0 and missed the Street's expectation of 51.0. This appears to support the possible disappointment in tomorrow's ISM manufacturing report that we are expecting (discussed on 10/29). In terms of other important economic data coming out this week, the BLS recently confirmed that it will release the Oct. employment report as scheduled, on Friday 11/2.
Wednesday, October 31, 2012
Monday, October 29, 2012
Our October ISM & NFP Projections
With the markets closed today and possibly tomorrow (Tuesday, 10/30), we thought to provide our estimates for some of the very important economic indicators to be released later this week - ISM manufacturing (Oct.), ISM services (Oct.), and state of employment (Oct.).
With some relevant data on regional manufacturing activities released earlier this month, we expect overall ISM manufacturing index (to be released on Thursday, 11/1) to come in at 50.0, a decline from 51.5 in Sept. The consensus currently stands at 51.5. In addition, we have projected ISM services index of 51.0, lower than last month's 55.1.
Based on our research and some estimates such as the ADP employment report (which is due out on Thursday, 11/1), we have projected a 75K increase in NFP for Oct. indicating a slowdown in hiring as change in NFP during Sept. was 114K. The consensus for Oct. stands at 125K.
We note that although the state of employment report is scheduled to be released this Friday, according to the Wall Street Journal, the Labor Dept. may delay it due to the current "weather emergency", the storm and hurricane Sandy, in the East Coast. We certainly hope and wish for everyone's well-being and safety.
Saturday, October 27, 2012
QE Policies Are Not Helping the Economy
It is good to see that some of our views is in-line with the very well-respected financial professionals out there. Below is the link to an article related to what the hedge-fund manager, David Einhorn, said about the Fed's monetary easing policies at the Buttonwood Gathering last week.
Friday, October 26, 2012
Q3 GDP Surprised on the Upside, but ...
Q3 annualized real GDP growth came in at 2.02%, above the 1.9% consensus, and certainly above our 1.5% estimate.
At first, we thought that the upcoming Presidential election may have 'impacted' the number. Then we asked ourselves to stop throwing those conspiracy theories around. Finally, after looking at the report, we concluded that conspiracy theory or not, the federal government consumption expenditures saved the Q3 GDP figure from disappointing Wall Street.
Let's put it this way, of the 2.02% GDP growth rate, more than 72bps were contributed by federal government consumption; the first positive contribution since Q2 of last year. Those 72bps represent a 9.6% annualized growth rate! Of those 72bps, 65bps, or 90.2%, were on national defense; and that represented a 13.0% growth rate! In addition, although government consumption on the state and local level continued to decline, it did so at a lower rate; from -1.0% in Q2 and -2.0% last year, to only -0.1%.
PCE represented 142bps of that 2.02% growth rate, which is positive but not very bullish, in our opinion. Last year, PCE in Q3 represented over 90% of the GDP growth rate. That figure is merely 70% for this year's Q3. We must note that both goods and services contributed positively to the Q3 GDP growth.
In terms of net exports, the decline of 1.6% in exports was the first decline since Q1 2009. This was driven by a significant 3.5% decline in exports of goods, the first decline since Q2 2009. The 3.1% increase in exports of services partially offset the very disappointing goods exports. Imports also declined; however, as usual, that decline contributed positively to the overall GDP growth rate.
In summary, while the headline GDP number was slightly better than the Street expected, we recommend not getting too excited about it as too much of it was driven by government consumption. By the way, this is BEA's initial GDP growth rate estimate. We expect this figure to be revised down the next time it is released, which will be approximately one month from now.
Update ...
It is currently 12:16 AM (PT) on Friday morning and we thought to provide an update. Overall, the equity market has dropped approx. 3.3% since the last time we posted (10/17/12). Economic data has been very mixed as it appears that some of the latest housing data hasn't been indicating a robust recovery, as many were hoping.
In addition, some widely followed companies have reported disappointing September quarter earnings. Facebook (FB) was not one of them as it beat both on the top and bottom line. It shot up 18%+ the day after earnings, closing at $23.23. On Thursday, it gave some of it back and ended the day at $22.56. We still value FB at $23/sh, as we have all along since the Company's much hyped IPO.
Although some big names such as AAPL and AMZN reported disappointing earnings on Thursday, it appears that much of the disappointments had been priced in. Whether those companies will keep declining as they have since late Sept. and early Oct., remains to be seen. We actually think that some of Friday's macro data would either put those stocks' downward trend into a higher gear, or they would help ease it a bit. The Q3 annualized real GDP growth is one such economic data. The Street is expecting 1.9%, while we're projecting only 1.5%, as mentioned on 10/9/12. If the GDP print is better than expected, we'd probably see some short covering in those names and others.
Lastly, the University of Michigan's consumer sentiment survey for October is also due out on Friday. Economists have estimated no change in that index. We note that we will also be cheering on the University of Michigan's football team on Saturday as they play Nebraska.
Wednesday, October 17, 2012
Better-than-expected Building Permits & Housing Starts
Housing data keeps improving, but then again, it is all in the eye of the beholder. Both building permits and starts in September blew away the Street's estimates.
Permits came in at an annualized rate of 894K, up from the downwardly revised 801K in August, and significantly above the 810K consensus.
- From the previous month, total permits went up 11.6%, driven mostly by MDUs of 5+, which went up nearly 23%. Permits for single-family homes inched up 6.7% m/m. Regionally, the Midwest led the way with a 19.5% increase.
- Permits increased 45.1% from last year; again, driven by the 5+ MDUs, which nearly doubled. Single-family homes permits were up 27.3%. In terms of Y/Y change, the West was the leader with a 56.8% increase from Sept. '11.
Housing starts came in at an annualized rate of 872K, up from August's upwardly revised 758K, and above the 765K consensus.
- From August, housing starts were up 15.0%, driven by a 25% increase in 5+ MDUs. Regionally, the West led the way with a 20.1% m/m increase, while the Northeast experienced a 5.1% decline.
- On a Y/Y basis, housing starts were up nearly 35%. Surprisingly, this was driven by the 42.9% increase in single-family home starts. All regions experienced growth from the prior year, with the Midwest leading the way with a 47.4% increase.
While these numbers are much better than expected, we continue to believe that if these starts are completed, they will boost inventory too much which then will put pressure on overall prices. In addition, such great numbers do not necessarily mean that the builders are seeing so much of an increase in demand. They could just be taking advantage of continuing lower construction costs. We note that the latest MBA data does indicate an increase in purchase applications, but at a declining rate.
Tuesday, October 16, 2012
Economic News Update ...
Industrial production and capacity utilization for September were in-line with the Street's expectations, but slightly below ours.
- Industrial production index edged up 40bps to 97.0 in September. Although the consensus was an increase of only 20bps, the end result was in-line with expectations as the August number was revised down by 20bps. We note the index remained below 2007 level.
- Production of consumer goods was unchanged from August as the continuing decline in durables (led by automotive products) was offset by slight turnaround in non-energy nondurables (led by clothing, foods & tobacco).
- There were also turnarounds in production of business, and defense & space equipment.
- The increase in capacity utilization to 78.3% from August's downwardly revised 78.0% did support the slight improvement we saw in the September NFP. However, as indicated in this morning's industrial production & capacity utilization report, capacity utilization remains 2% below its long-run average, which is good news and bad news. The good news is that there may not yet be time for fears of too much inflation. However, the bad news is that during stable economic growth periods capacity utilization has been between 80.0% and 85.0%, and we are currently far from those levels.
Headline CPI came in slightly above the Street's expectations. September CPI increased 0.6% from August, higher than the 0.5% consensus. Most of the increase was driven by higher gasoline prices. Core CPI m/m change was only 0.1%, less than the Street's 0.2% estimate. However, we note that the Y/Y changes for both headline and core CPI were 2.0% in September.
Surprisingly, there was no upside surprise in the NAHB housing market index. It came in at 41.0, in-line with expectations. However, this was the highest level since Jun '06! In addition, the index increased for the seventh straight month. While the traffic component of this index continued to increase, its current and future sales measures remained unchanged. As usual, the homebuilders are blaming "overly tight credit conditions". The homebuilders' ETF, XHB, is up only 0.3%, trailing the overall equity market.
S&P 500, which we continue to view as overvalued, is loving the better than expected economic news. It is up 0.75% at 1451. And VIX continues to give back last week's gain; down 3.3%.
Monday, October 15, 2012
September Retail Sales, NY Fed Mfr. Survey, & more ...
Details regarding September's retail sales report and October's NY Fed manufacturing survey results are provided below. We have also included our forecast for the September industrial production and capacity utilization numbers, which are due out tomorrow morning.
Retail Sales (September)
- The initial retail sales report for September came in better than most analysts expected; a 1.1% sequential increase versus the analysts' 0.7% estimate.
- Excluding auto and gasoline sales, retail sales grew 0.9%, significantly better than the 0.5% consensus.
- Based on the data provided by the Dept. of Commerce, the 4.5% growth in sales of electronics and appliances appear to have been the driver behind the better than expected retail numbers. We could assume that at least the initial sales of Apple's (AAPL) iPhone5 could be partially responsible for this growth.
- Such good numbers could be too good and too early. They could negatively impact sales during Christmas season, given that overall wage growth remains stagnant.
- Auto and parts sales went up 1.3%, while sales at gasoline stations increased 2.5%
- We note that the August figures were revised higher. Overall retail sales were bumped up 40bps to 1.3%. Excluding autos and gasoline, that figure was revised higher by 20bps to 0.3%.
Empire State Mfr. Survey (October)
While the September retail sales surprised on the upside, NY Fed's manufacturing survey for October was disappointing. The overall index came in at -6.16, an improvement from September, but below the -3.0 consensus.
- New orders sub-index remained negative at -8.97, but yet better than the prior month's -14.03. This figure has been below zero for four consecutive months, after being in positive territory for seven months in a row.
- Not surprisingly, without much improvement in new orders, the shipment sub-index also dipped into negative territory; -6.40 in Oct., from 2.75 in Sept.
- Downward trend in the employees sub-index continued for the third straight month as that figure came in at -1.08, certainly a worsening from September's 4.26. Given that the workweek number also deteriorated, we do not expect much improvement in next month's Empire State Mfr. employees sub-index.
- The inventories sub-index was -2.15, down from prior month's 0.00. Initially, we thought we might see some inventory replenishment next month; however, the forward-looking inventory sub-index proved us wrong. That figure remained pretty much unchanged at -4.30.
- Most of the survey's forward-looking indicators show that optimism is slowly declining. The general business conditions fwd index declined to 19.42, from 27.22 in September. Fwd new orders sub-index dipped to 15.05, from 17.02.
- It appears that more manufacturers are expecting an increase in prices that they pay and in prices that they receive during the next six months.
- No change is expected in the number of employees during the next six months. However, average workweek will likely decline further as that fwd sub-index came in at -11.83, a significant decline from prior month's 2.13.
- Many more manufacturers are also expecting less CapEx during the next six months. Lastly, the fwd technology spending sub-index was pretty much unchanged at 7.53.
Other possible market moving economic indicators are due out tomorrow, including the September CPI for which the consensus is 0.5% (core CPI consensus is 0.2%) and NAHB's housing market index (consensus is 41.0). September industrial production and capacity utilization, for which we have our own models, will also be released tomorrow. We expect the industrial production index to come in at 97.5, approx. 70bps higher than the prior month's 96.8. The consensus is 97.0. In addition, we have projected a capacity utilization rate of 78.8%, up from August's 78.2%, and above the 78.3% consensus.
Housing starts and permits stats are due out on Wednesday morning. The market expects 765K and 810K for starts and permits, respectively. Initial jobless claims from last week will be released on Thursday. The consensus is 365K, a significant increase from the prior week's surprisingly low 339K. Although we do not usually project the initial jobless claims, we do expect Thursday's number to be higher than the consensus as not only will the upward revision trend of this economic indicator continue, but we also note that the applicable seasonal factor is less than the prior week's. In other words, the 26K increase in initial claims that economists are looking for require only an increase of 10K in the non-seasonally adjusted initial claims number. Philly Fed's manufacturing survey will also be released on Thursday. The Street expects that index to move slightly into positive territory, 0.5. Lastly, September existing home sales numbers are due out on Friday morning. The consensus is 4.75mil.
Thursday, October 11, 2012
Some Thoughts on Latest Initial Jobless Claims
First, we'd like to apologize for this late post as we were having technical difficulties uploading charts, thanks to Google (GOOG). Of course, the stock is up 1% and is one of our favorite companies. We'll let this one issue pass.
Now, let's discuss initial jobless claims, which came in significantly below expectations; 339K versus 370K. In fact, the initial claims number was much lower than the lowest estimate of 362K out there. The range of estimates was 362K - 375K. The weekly report from BLS did not indicate anything abnormal in terms of certain states not reporting initial claims, etc. However, in our opinion, the number itself was an outlier.
Now, let's discuss initial jobless claims, which came in significantly below expectations; 339K versus 370K. In fact, the initial claims number was much lower than the lowest estimate of 362K out there. The range of estimates was 362K - 375K. The weekly report from BLS did not indicate anything abnormal in terms of certain states not reporting initial claims, etc. However, in our opinion, the number itself was an outlier.
Initially, we thought that the pre-determined seasonal factor (SF) may have contributed to such a result. Below is a chart showing the SF used by BLS for the first week of Oct. since 1980. It is clear that BLS ups the SF every 5 - 6 years to 90 and above, then it slowly brings it back down to the low 80's or high 70's; and then that 'cycle' starts all over again. Based on the data, the Presidential election appears not to be one of the drivers behind the 5-to-6-year increase in SF.

Source: BLS
We note that the higher the SF, the more favorable it is for the SA (seasonally adjusted) or headline initial claims. Last week's SF of 96.4 was the second highest SF during the last 32 years. The highest was 97.3, applied in 2006. The average SF since 1980 is 86.3. If that was applied to last week's NSA (non-seasonally adjusted) claims, the SA result would have been nearly 380K! The median and average SF for the 'spike' years (as shown on the graph above) are 93.7 and 94.3, respectively. With those SFs, last week's SA initial jobless claims would have come in at nearly 350K, below the consensus, but much higher than the official 339K.
We also looked at the one week change in NSA versus SA for the first week of Oct. since 1980. As displayed in the graph below, NSA and SA have moved pretty much in the same direction most of the time, except in 2001 and the current year. The graph shows that while last week's NSA figure increased by nearly 26K, its corresponding SA number declined by 30K! This supports the notion that last week's initial claims result is an anomaly.

Source: BLS
We are not saying that BLS employees responsible for gathering and massaging such data were on vacation. Nor do we have any conspiracy theories to explain this. We are simply saying that last week's initial claims number is an outlier. We will see if we are correct or not during the next few weeks, where it is very likely that the numbers will be revised. By the way, yes, the previous week's figure (last week of Sept.) was revised higher. Now, that upward revision certainly wasn't 'abnormal'.
The market's reaction to this news also hasn't been as much as many thought, especially after the recent downward trend that we have seen. S&P 500 is up 0.4% at 1438. This morning's news certainly prevented S&P 500 to go lower than its 1430 support level. It remains below its linear regression level of 1440. We note the index is still trading below 1447 10-day EMA. VIX is losing some steam today, down nearly 4%. And the energy and financial sectors are doing well this morning, up 1.3% and 0.9%, respectively. Lastly, congrats to the Yankees and Rauuuuuuul! Last night's victory was one for the ages ... in our opinion.
Tuesday, October 9, 2012
GDP Estimate Update & AA's Q3 Earnings ...
Alcoa (AA) reported Q3 results and beat expectations both on the top and bottom-line. Revenues of $5.83bil were much higher than the Street's $5.57bil estimate. Better revenues from AA also positively impacted our Q3 GDP estimate. We now expect real GDP annualized growth rate of 1.5% for Q3, up slightly from our initial estimate of 1.4%. We note that this number remains below the 1.6% consensus but is slightly higher than Q2's 1.3%.
Below is an update on what AA expects from its end markets in 2012.
- Slightly upped growth estimate in the automotive space in North America to 11% - 15%, from 10% - 14%.
- North American heavy trucks & trailers lowered significantly to 2% - 4%, from 4% - 8%. We note the Company lowered its assessment on this market in Q2 also.
- Beverage can packaging market in North America was unchanged. Sales growth projection remained between -1% and 0%.
- 5% sales decline projection for the commercial building and construction market in North America was maintained.
- For Europe, heavy trucks & trailers were lowered to decline of 8% - 11%, from decline of 3% - 8%. In addition, beverage can packaging sales growth was lowered to 4% - 5%, from 5% - 7%.
- AA's assessments certainly provided more evidence of the continuing slowdown of China's economy. While there was a bright spot in China's automotive market, as AA increased it projection to 4% - 7% growth, from its previous wider range of 2% - 7%, the Company slashed its outlook on heavy trucks & trailers in China. It now expects a decline between 18% and 21% in 2012, compared with its previous assessment of a 3% - 8% decline. AA also lowered its outlook on beverage can packaging sales growth in China to 5% - 8%, from 15% - 20%.
Monday, October 8, 2012
Q3 GDP Estimate & Our 12-Month Target for S&P 500
We thought to provide our initial estimate of annualized real GDP growth for Q3. We currently project a GDP growth rate of 1.4%, below the 1.6% consensus, but slightly higher than Q2's 1.3%. We note that the annualized and seasonally adjusted growth rate of Alcoa's (AA) revenues is one of the factors used in our model. Our Q3 AA revenue assumption is based on the Street's $5.57bil estimate. AA's results, which will be released tomorrow after the close, may force us to adjust our estimate. While AA is no longer a bellwether for the equity market (as the market is no longer based on fundamentals), we believe its top-line does provide some color on current and future domestic and global economic growth.
From a slightly more fundamental standpoint, we looked at the latest S&P 500 EPS estimate for CY '13. Given the modest economic growth (without much acceleration expected during the next couple of years) we thought that trading at approx. 12.5x 2013 EPS, S&P 500 may be slightly overvalued. To get a better idea, we got our hands on the experts' average annual growth rate of earnings for the next five years. According to S&P, that figure currently stands at 10.83%. We thought that given the current macro environment, a PEG of 1.0 might be appropriate for valuing the S&P 500. Applying a P/E of 10.83 to the CY '13 EPS estimates gets us an S&P 500 target or valuation of 1247, approx. 14% less than where it closed at today.
Although fundamentals are no longer driving the market as much as they used to or as much as they should, in our opinion, they do provide a better, or more realistic perspective on valuation, which will come in handy in the future.
Friday, October 5, 2012
September Employment Report & Its Revisions Made Everything Appear Better
The September employment report was certainly a surprising one, even though the NFP count came in only 1K higher than the Street's estimate. The August number was revised up by 46K! Again, August's NFP, the figure that many believed pushed the Fed to implement QE3, was revised up by 46K, thanks to nice bump up in government jobs! The number of government jobs added in August was revised up by 52K, which pushed it from -7K to +45K! Conspiracy theorists please come out and make a statement; the time is now. So, let's put it this way - change in NFP for the past two months was 256K, compared with our 241K estimate, and the Street's ever-conservative 210K. With respect to various government economic data, which continue to be revised up or down significantly, our models' 'revision factors' need significant adjustments continuously. One thing is certain; today's numbers will give President Obama a lift which he certainly needed after that embarrassing performance in the first election-2012 debate earlier this week.
- September NFP came in at 114K, below our 145K estimate and slightly above the Street's 113K. As a reminder, the August NFP was revised up by 46K. By the way, the July number, which was revised down by 41K in the August employment report, was revised up by 41K in the September report! We are trying to give conspiracy theorists more ammo.
- The official unemployment rate fell to 7.8%.
- Private NFP went up by 104K, which means that 10K of jobs added were in the government sector. Unlike the rest of the Street, we had assumed an increase in government jobs. However, what caught our eye was that a big chunk of the overall NFP upward revisions for July and August was in the government sector! For July and August, the number of government jobs were revised up by 39K and 52K, respectively!
- Although manufacturing declined by 16K (we had assumed a slight increase), construction and education & health services went up by 5K and 49K, respectively.
- By the way, while the official unemployment rate dipped 30bps to 7.8%, the U-6 figure remained unchanged at 14.7%.
- Given the endless number of revisions in this report, looking at the net changes is basically useless, in our opinion. We are confident that this report will make the next Presidential debate even more interesting. Some new words or phrases will likely be added to the Presidential debate drinking game.
S&P 500 is up 0.5% while VIX is down more than 5%. Gold futures is down around $10. By the way, congrats to the Yankees for winning the AL East, and we are hoping the Jets will at least show up for the Monday night game against those Texans.
Wednesday, October 3, 2012
September Services ISM Beats Expectations
September services ISM of 55.1 was above the Street's 53.5. The employment sub-index actually declined 2.7 to 51.1 from the prior month, indicating we may have over-estimated growth of employment in services in our September NFP projection. However, we will stick with our 145K NFP estimate.
- While ISM services' new orders sub-index increased to 57.7 (from 53.7) and inventory declined, backlog of orders went below 50.0, indicating contraction.
- Prices increasing for the third consecutive month, combined with decline in backlog of orders, indicate inventory replenishment and/or increase in headcount may take a bit longer. This also goes along with the ISM report's lower inventory sentiment sub-index.
Overall, while we still think Friday's employment report will beat expectations, the rally may be short-lived. Then again, that is based on the assumption that markets are based on fundamental, which may no longer be true for a very very long time.
ADP September Employment Report
September ADP came in at 162K, significantly higher than the 140K consensus. We will stick with our NFP net change estimate of 145K for September even after the ADP surprise to the upside. The Street consensus for NFP is 113K.
- While the number was better than expected, we note that it was accommodated by downward revisions to the July and August figures. July was lowered by 17K and August by 12K.
- Increases in manufacturing and construction jobs (4K and 10K, respectively) are pretty much in-line with our assumption for Friday's NFP count.
- The same can be said of the 144K jobs added in services, a nice chunk of which we believe will be categorized as temp services in Friday's NFP report.
Monday, October 1, 2012
Market Update & Our September NFP Estimate
The market remains uber-excited about the better than expected September Mfr. ISM which came out earlier this morning. S&P500 is up 0.9%. And VIX just got back in the red, down only .1%. With respect to S&P's sector ETFs, while the more cyclical sectors, such as materials, energy, financials, and industrials, are up 1%+, we note that the less cyclical consumer staples is also up nearly 1% while consumer discretionary is actually trailing staples, up only 0.5%.
Assuming a September ADP change of 140K, which is the Street's estimate, we expect to see a net change of 145K non-farm jobs in Friday's September employment report. Our estimate is at the high-end of the Street's 75K - 162K range and certainly above the 113K consensus. Our higher projection is based on the assumption of NFP growth in construction, manufacturing, education & health services, and temporary help services, partially offset by some weakness in retail trade and leisure & hospitality. Given the upcoming elections in November, we also expect a slightly higher NFP count on the government side of its so-called services. The Street expects a decline of 17K in the government NFP count.
Sell-Siders' Usual Underestimation Made Mfr. ISM a Positive 'Surprise'
We find it very interesting that the sell-side experts continue to under-estimate the disappointing modest economic growth in order to make anything look good. The perfect example of that is the September manufacturing ISM report which was released at 10AM (ET) this morning. The ISM index came in at 51.5, much higher than the 49.7 consensus. Of course, as we had mentioned last week, we were a bit more realistic than the sell-siders whose main objectives are to bring back more retail investors and increase transaction volume on their end. Our ISM estimate was 51.0. By the way, the Street's estimate range was 48.0 - 50.6. With such a surprise, the basis of which was again created by the phony sell-siders' estimates, S&P 500 is now up approx. 1%.
Mfr. ISM (September)
- September ISM index of 51.5 shows expansion after three consecutive months of contraction (below 50.0). Again, our estimate and the Street's were 51.0 and 49.7, respectively.
- Basically every sub-index, except for the producer's inventories, increased from the prior month.
- While new orders inched up above 50.0, production remained at sub-50.0. However, given the decline in inventories, combined with improvement in new orders, we will probably see production get over 50.0 this month.
- We note that the increase in customers' inventories could limit the upside for October's ISM index.
- In addition, while the imports sub-index did improve, it remained below 50.0 for the second consecutive month. This could indicate that the increase in production and new orders could be driven more by inventory replenishment on the producers' end, rather than an increase in overall demand. In other words, again, the upside for the next few months may be limited, making this positive 'surprise' short-lived.
- Lastly, the employment sub-index moved up nicely to 54.7 from 51.6. This should push up the Street's estimate for NFP (due out this Friday), but again, those sell-siders do their best to create that positive 'surprise'. We will post our NFP estimate later this morning.
Friday, September 28, 2012
More Disappointing Economic Data ...
It appears that this week can be considered as a week of bad
economic data. Today, the personal
income & spending report was disappointing, and consumer sentiment and the
Chicago PMI came in below expectations.
Personal Income & Outlays (August)
August personal income & spending report showed less
than expected growth in income, moderate growth in spending, and growth in
overall prices outpacing growth in income.
We view such report as disappointing as the higher spending and higher
inflation gauge (PCE price index) were mainly driven by higher gasoline prices
and not necessarily by an increase in demand.
- Personal income increased by only 0.1% from July. In addition, the July monthly change figure was actually revised down from 0.3% to 0.1%.
- Consumer spending was in-line with expectations; up 0.5% from July.
- Y/Y growths in personal income and spending were revised down by 20bps and 10bps, respectively.
- Headline PCE price index increased by 0.4% from July, lower than the 0.5% consensus. However, it was higher than growth seen in income. Core PCE price index m/m change of 0.1% was in-line with expectations. We note that the Y/Y changes in both the headline and core inflation measures were less than the Y/Y changes in personal income and spending.
Chicago PMI (September)
The Chicago PMI not only came in below expectations, but
also showed contraction during September.
This will likely lower overall estimates for the ISM report which will
be released on Monday. We still expect a
slight improvement (51.0 compared with 49.6 in the prior month) in the national
ISM report.
- The 49.7 reading was significantly below the 53.0 consensus.
- Most sub-indexes, including new orders, order backlog, inventories, employment and capital equipment, declined from the prior month. New orders were very disappointing as they declined significantly to 47.4 in September from 54.8 in August.
- According to the report, the employment sub-index came in at a 2.5-year low, while new orders and order backlogs were at their lowest since mid-2009.
- Purchases of capital equipment came in at a 17-month low.
Consumer Sentiment (September)
University of Michigan's consumer survey results also came
in below expectations; 78.3 versus 79.0.
However, the results were better than the prior month's and
significantly above last year's.
Respondents were less enthusiastic about current conditions, but expect
improvement going forward driven by optimism about the economy and jobs during
next year.
Thursday, September 27, 2012
Our Final September Mfr. ISM Estimate
Our final estimate for the upcoming manufacturing ISM index is 51.0. Unlike August's 49.6, it appears the September number will indicate some expansion within manufacturing. We note that as the regional surveys released by several federal reserve banks showed, overall manufacturing remains a mixed bag of improvements and continuing decline. We are still unaware of what the consensus for manufacturing ISM is. The official ISM report will be released on Monday (10/1) at 10AM (ET).
Not Too Many Bright Spots in Today's Economic News ...
Initial Jobless Claims
Let's start with the good news - initial jobless claims came in significantly below expectations. Annualized initial claims of 359K were much lower than the 376K consensus. Of course, the prior week's number was revised higher by 3K to 385K. We note that even with such a positive surprise, the average initial claims for September remain above what we saw in August. This week's initial claims could be the difference maker in terms of whether September NFP will come in higher than August's.
KC Fed Manufacturing Survey (September)
Now the bad news, and we will start with September manufacturing survey conducted by the Federal Reserve Bank of Kansas City. The composite index for that survey was 2.0, lower than the 5.0 consensus and a significant decline from 8.0 in August. Not much looked encouraging in this report. Production, shipment, new orders, and backlog sub-indexes all moved into negative territory from the prior month. While the number of employees sub-index remained positive, it dipped to a mere 1.0 in September from 2.0 in August. Continuing decline in the average workweek sub-index indicates even less hiring or some layoffs coming up in October. Workweek declined to -13.0 from -5.0! The forward-looking part of the survey was also not very encouraging. In fact, new orders are expected to increase only slightly, while capex is expected to decline. Also, those surveyed do not expect much of an increase in hiring during the next six months.
Durable Goods (August)
Durable goods orders for August, although disappointing, did have a few bright spots.
Let's start with the bad durable goods numbers. Change in new orders from July came in at -13.2% compared with the -5.0% consensus. Excluding transportation, new orders were even more disappointing, coming in at -1.6%, lower than the Street's expectation of a 0.2% growth. Orders for transportation equipment took a dump with a 34.9% decline.
Excluding defense goods, new orders dipped 12.4% from July. Orders for defense capital goods declined 40.1%. We note that given the upcoming UN speech by Netanyahu, this figure could get bumped back up for the rest of the year, and maybe many more years, as politicians continue to market their pitch of attacking Iran and starting a potentially very costly war.
Now, let's move to a couple of bright spots within the durable goods report. New orders for non-defense capital goods went up 1.1% from the prior month. We believe this represents mostly construction related capital goods such as machinery as we did see a better than expected uptick in homes being built in late Summer. The other good news was the little growth, 0.6%, in total inventories. Although we do not see that figure improve significantly for September, we do expect it to increase more as we get closer to the elections followed by a significant growth or a significant drop post elections, depending on who gets elected.
Pending Home Sales (August)
While homes continue to be built as we believe some data in durable goods orders showed, recovery in the housing market may not be as great as the market expected. August pending home sales index was very disappointing as it declined 2.6% from the prior month level, significantly below the +0.3% consensus. In fact, it was even worse than the lowest estimate out there (-1.5%). Although this index is for existing homes, it is viewed as a leading indicator for the housing industry. Some may use a supply shortage to justify such a miss. However, such supply shortage is due to increased hesitancy in going after homes in foreclosure. This also pushes up prices artificially. Basically, once more foreclosed homes hit the market, combined with the uber-bullishness of homebuilders, supply shortage will end followed by too much supply, which we believe will create pressure on prices, which wil not be good news.
Q2 GDP
Given our pessimism the last six months, not many expected economic data to come in even below our estimates, but this was the case this morning with respect to the Q2 annualized real GDP growth. We have stuck with our initial estimate of 1.6%, while the Street was expecting 1.7%. The official figure came in at a mere 1.3%. Personal consumption, residential and nonresidential investments were all disappointing. Although this data is for Q2, we note that we have not seen much improvement in the Q3 economic indicators.
As a reminder, August personal income & spending, along with University of Michigan's consumer sentiment survey results for September, will be released tomorrow. After declining nearly 2% from last week's close, S&P 500 is up 0.4%.
Wednesday, September 26, 2012
August New Home Sales Missed Expectations
Although a bit delayed, we decided to provide a summary on and our thoughts about today's slightly disappointing new home sales data.
- August new home sales annual rate of 373K was below the Street's 380K estimate. July sales were revised up 2K to 374K.
- Y/Y sales were up in all regions with the West and Northeast leading the way with 64.6% and 56.5% increases, respectively.
- On a monthly basis sales were down 0.3% from July. This slight decline was driven mainly by nearly a 5% dip in new home sales within the Southern region. Northeast led the way with 20% sequential increase.
- Months' supply was unchanged at 4.5, and remained at the lowest level for the year.
- Based on non-seasonally adjusted data, median and average new home prices jumped in August when compared with July.
- However, the data also showed an increase in months' supply to the highest level since Feb. of this year.
- The percent distribution of new homes sold based on price categories explained not only the increase in prices but also in inventory. Sales of homes within the second highest price category ($500,000 - $749,999) jumped to represent 8% of total homes sold in August. This figure is not only double that of what we saw in July, but also higher than last year's 5%. In addition, it is above the 6% overall average for 2010.
- On the other side, sales within the second lowest price category ($150,000 - $199,999) represented only 16% of total sales in August, significantly below July's 25%, and 2010 and 2011 averages of 24% and 22%.
In our opinion, the widening gap demonstrated here between sales of more expensive and of cheaper homes, could result in further increase in overall prices but also possibly in increase in supply or inventory, which may create pressure on prices and limit this housing bottoming out and/or recovery. While quantitative easing may have brought mortgage rates lower, the beneficiaries are mostly the wealthy potential home buyers and/or institutional investors that initially had enough capital to make big purchases even if rates were 200bps higher. We remain doubtful about the trickle-down effect that the Fed and everyone else is hoping for, especially given the not very impressive growth in jobs and average wages or income. Tomorrow's release of last week's initial jobless claims, along with Friday's release of personal income & spending in August, may provide a clearer picture.
Tuesday, September 25, 2012
Our Initial September Mfr. ISM Estimate
With the manufacturing ISM for September due out next week, we thought to provide some color regarding where we think that number will come in at. We believe September manufacturing ISM will be within the 50.0 and 52.5 range.
Our manufacturing ISM model does include results of the Federal Reserve Bank of Kansas City regional survey, which will not be reported until Thursday morning. Once that number is out, we will have our final estimate by that afternoon. The consensus for this economic indicator is not out yet, but we think it will be above 50.0, which is encouraging for the market, especially after coming in below 50.0 for three straight months. However, based on regional employment sub-indexes and initial jobless claims, we do not expect this month's NFP to be as encouraging as the ISM. We will post our NFP estimate at the end of this week.
Sunday, September 16, 2012

Thursday, September 13, 2012
Bernanke Proved Us Wrong
The Fed announced QE3 earlier today. Unfortunately, we had given the Fed too much credit when we assumed it would not announce nor implement a QE before the elections. Our assumption was also based on the recent front running spike we had seen in the equity market. Again, we were certainly wrong. The S&P 500 is up 22 points, or 1.5%. VIX is taking dump, down nearly 10%. Gold futures is trading at $1766, up 1.9%; and WTI oil futures is up 1%.
Before the FOMC press release, August PPI came in at 1.7%, 50bps above expectations. Again, prices, input prices are rising. Although the core PPI was in-line with expectations, today's QE3 announcement will likely make those volatile components of PPI, foods and energy, less volatile while they continue to increase, pushing up input costs even more. This is not good news for the economy. At some point, those higher costs will be passed on to consumers that are not seeing their wages increase. This is also not good news for the economy. Higher input costs may also slow down the very modest growth in jobs that we have seen the last few months. Again, this is not good for the economy. Simply put, contrary to how the Fed 'marketed' its latest move, QE3 will not help improve the job market. In addition, it does not address the lack of demand that we are seeing in this economy.
The Fed also released its so-called economic projections, all of which was revised to show less optimism in 2012, followed by improvement in 2013, and baam, happiness and glory days coming back in 2014 and 2015. Of course, the Fed's projection of inflation, based on PCE, was not changed much for this year or next. However, for 2014 and 2015, the upper end of the inflation forecast range is above 2% (for both headline and core inflations). So, all of this monetary easing better work before 2014 or else; at least that is what the Fed is implying.
Yes, we have been wrong regarding the Fed's action, but we continue to ask - how does all of this monetary easing help "foster maximum employment and price stability"? Yes, as Bernanke said, the weak job market does concern many Americans. Whether his monetary easing will help create jobs is still a big question, even after four years!
Bernanke keeps saying that the monetary policy will continue until the Fed sees signs of improvement, but he fails to tell us what those signs may be. In addition, the Fed wants the MBS purchases to lower mortgage rates in order to, hopefully, attract more home buyers. Mortgage rates have tumbled for the last few years but we haven't seen much improvement in housing. In our opinion, a combination of jobs, higher income, and lower rates would increase demand within the housing market. Unfortunately, the Fed's policy does nothing to address the first two - jobs and income.
Speaking of jobs, last week's initial jobless claims of 382K were much higher than the 369K consensus. BLS stated that 9K were due to the tropical storm, Isaac. Even without that, seasonally adjusted initial claims would've come in at around 371K, above the consensus. Of course, the prior week was revised higher.
While the equity market keeps going up and we continue to realize that, for the time being, we made the wrong call on the QE matter, we remain pessimistic. In our opinion, the current spike in the stock market has increased the probability of a correction further before the end of this year. By the way, with all of this great news, the less risky sectors such as consumer staples are still up nicely compared to other sectors. In fact, only two other sectors, materials and financials, are up more than the consumer staples. This is pretty interesting.
Monday, September 10, 2012
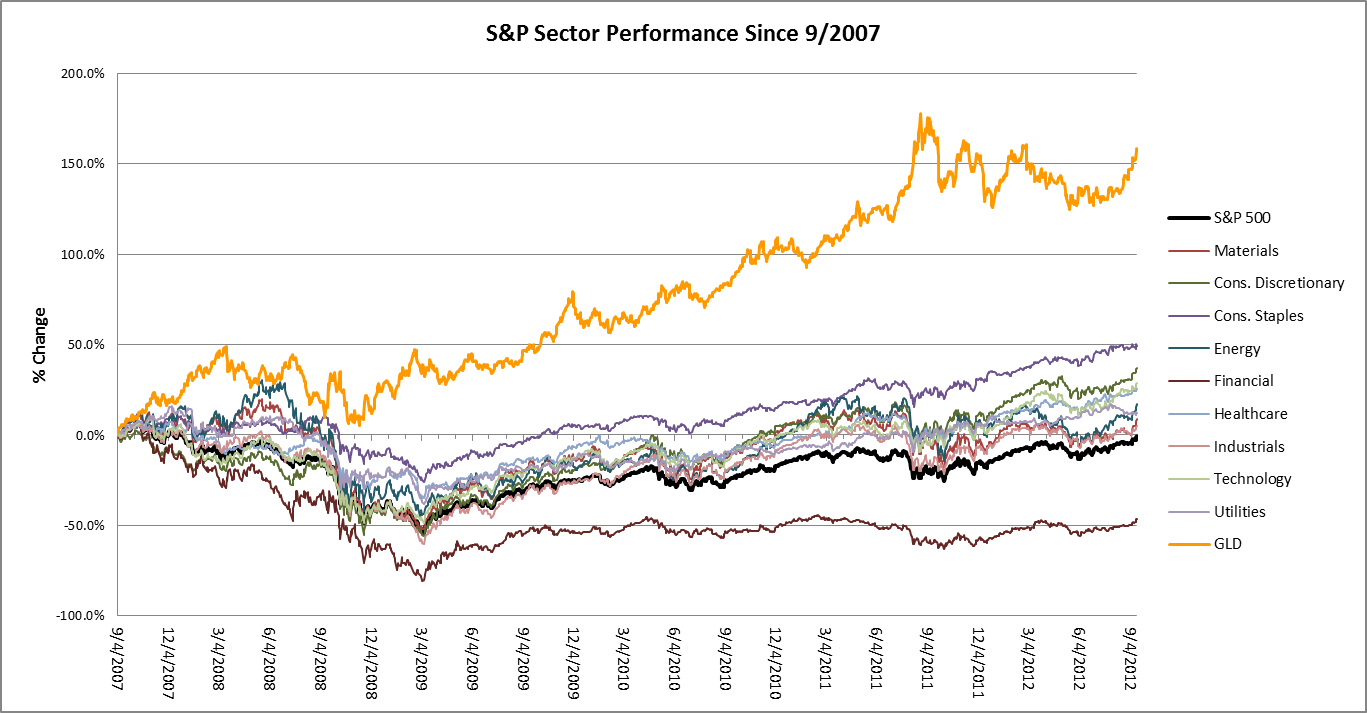
Sector Performance Update & Comments on Upcoming Economic Data
For the week which ended on 9/7, monetary easing was certainly in-play, even though we believe it has been priced into the US equity market for a very long time. As shown in the table and chart at the end of this post, the equity market performed very well driven mainly by encouraging remarks made by the ECB and mixed economic data, which did not really lower the chances of central banks actually implementing those encouraging remarks and strategies. How and when the monetary easing will be launched remains to be seen.
Some important economic indicators are due out this week. In addition, the Fed's FOMC meeting will take place on 9/13. We believe the Fed will not announce any additional specifics regarding a QE3. As usual, it will say that all options remain on the table, hoping that such a positive comment will act as a psychological QE, driving asset prices even higher, and hopefully increasing businesses' confidence in hiring. We note that expectations, as indicated by the upward movement in the stock market and articles written in the WSJ, are very high. It won't be too difficult for Bernanke to disappoint.
Consumer credit for the month of July will be released on Monday. We will likely see a jump in that number compared to June, mainly due to the m/m 0.4% growth we saw in the July PCE, combined with slower growth of 0.2% in overall wages.
Wholesale inventories for July will be out on 9/12. We expect an increase from the prior month not necessarily due to rising demand, but mainly driven by seasonal factors along with hedging against rising prices.
Initial jobless claims is due out on Thursday, 9/13. The consensus stands at 369K. We might get a figure slightly above the consensus as last week was shortened due to the Labor Day holiday, which we think forced some to delay their jobless claims filing the prior week, for which they had to make up last week. We also won't be surprised by an upward revision of the prior week's number.
As we began to point out about a month ago, actually a month too early, prices have been creeping up. We will see evidence of that in the August PPI and CPI, which are due out on Thursday and Friday, respectively.
August retail sales growth will also be released on Friday. Given the better than expected auto sales numbers, overall retail sales growth will likely be close to the Street's estimate of 0.8% or slightly higher. However, excluding auto sales, the retail sales growth rate will be only around 0.5%.
Industrial production and Capacity utilization for August will also be out on Friday. We usually have our own estimates for these two indicators. Regarding industrial production, we expect a decline of approx. 0.8% from July, or an index of 97.2. The consensus is a decline of only 0.2%. Our estimate for capacity utilization matches the Street's 79.2, which represents a 0.1% decline from July.
University of Michigan's initial consumer sentiment survey for September is also due out on Friday. The Street's estimate is 73.3, representing a one point decline from August. Given our assumption of a jump in consumer credit in July (to be released on Monday) and August (will not be released until a month from now), driven by a not-so-robust job market and slow growing wages, we think it is likely that the consumer sentiment will disappoint. In our opinion, the factors mentioned above will more than offset the recent spike in the equity markets. In addition, while the upcoming election may influence consumers' responses, we think that given the close race between the candidates, the election-driven positives and negatives will likely offset each other during the next two months.
Lastly, we were of course very disappointed by the Wolverines' loss to Alabama last week. However, the Wolverines survived a scare from the Air Force on Saturday and came away with a win at home. Also, surprisingly, our beloved Jets scored many TDs in Sunday's convincing win over the Bills. Of course, next week's matchup with the Steelers might be a different story. And by the way, luckily with only 22 games remaining, the Yankees are up by one game over the surprising Orioles.
Below is the table and chart representing last week's sector performance update.


Friday, September 7, 2012
August Employment Missed Expectations
The unemployment data for August, which missed expectations as we had estimated, is not very encouraging, unless one is still on that QE3 bandwagon. However, as many politicians and optimists might say - at least jobs were added. With such a disappointment in jobs numbers, the market opened slightly up. The S&P 500 is up more than 3.5 points. VIX is down another 1%. And gold futures hit $1730 with hopes for a QE. It used to be that the stock market was a leading indicator of the economy. These days (starting a couple of years ago), the stock market is a leading beggar for more money printing by the Fed and other central banks around the world; all of this while the economy barely grows.
- August NFP came in at 96K, below our estimate and the overall consensus. We note that we expected 110K, compared to the Street's more optimistic estimate of 125K. The official unemployment rate fell to 8.1% from July's 8.3%.
- Further push for a QE3 was brought on by downward revision of the July NFP; revised lower by 41K. Private NFP for July was lowered by 20K.
- With a net loss of 7K in government jobs, the private NFP figure was 103K, significantly below what the ADP data was hinting yesterday.
- August hourly earnings actually declined by 1c! This is alarming given rising prices. In addition, it again may question the reality and stability of what many refer to as the housing recovery.
- Average weekly hours worked stayed at 34.4. We note that the July figure was revised down by 0.1 hours.
- U-6 unemployment rate dipped down to 14.7% from 15.0%, which is somewhat positive.
- Labor force participation rate declined another 20bps from previous month to 63.5; that's down from last year's 64.1.
- Number of people employed declined 119K from July; up 2.34MM from last year. We note that the civilian labor force shrunk by another 368K from July.
- The long-term unemployed (27+ weeks) figure declined by 152K from July. It appears that reality has caught on to manufacturing, as the sector lost 15K jobs in August compared with July. Also, the initial net addition of 25K manufacturing jobs for July was lowered to 16K. We did mention last month that the July manufacturing jobs number was suspect.
- 119K jobs were added in the private space, lower than the 139K boost it got in July.
- Temporary help in professional and business services dipped 4.9K, which is not a good sign given the accompanying slower rate of growth we are seeing in the NFP (incl. private NFP). we also note that July's 14.1K net adds in temporary help services was revised down to 6.7K. In addition, the dip in temp jobs brought down the increase in overall professional and business services to only 28K, compared with the 40K+ we had seen the last few months.
- The seasonally strong leisure and hospitality space added another 34K jobs in August, after adding 28K in July (revised up from 27K).
Thursday, September 6, 2012
ADP & Initial Claims Beat Expectations; NFP Estimate Updated
Better than expected ADP employment numbers and last week's initial jobless claims, along with ECB's continuing promises of monetary easing, have pushed S&P 500 futures up more than 8 points. Gold front month futures is above $1700. It appears VIX will take a dive at least in early trading this morning. The higher ADP number upped our August NFP estimate to 110K from the 95K we posted earlier this week. We note the NFP consensus remains at 125K.
August ADP private payroll figure of 201K was significantly above the 143K consensus. In addition, the July number was revised up by 10K.
Initial jobless claims came in at 365K, below the Street's 370K estimate. This number is somewhat encouraging as initial claims had been abover 370K for three straight weeks. Of course, optimism must be held in check as the prior week's number was again revised up.
Tuesday, September 4, 2012
A Very Good Interview (from Yahoo! Finance)
This interview shows just how dependent the market is on the Fed.
http://finance.yahoo.com/blogs/breakout/global-central-bank-put-drive-stocks-higher-2013-165122836.html
http://finance.yahoo.com/blogs/breakout/global-central-bank-put-drive-stocks-higher-2013-165122836.html
Market Update & Our August NFP Estimate
The market remains in the red with the S&P 500 still down nearly 8 points. VIX has 'stabilized' a bit, up only 6.5% compared to nearly 9% earlier this morning. Out of the sector ETFs, only utilities and consumer staples are in positive territories. However, other sectors have begun to pare their losses.
Assuming an August ADP of 149K, which is currently the Street estimate, we expect a 95K August NFP print on Friday. Our estimate is below the 125K consensus.
If the NFP is as bad as we think, the market's negative reaction could be limited with the growing expectation of a QE3 announcement at the Fed's FOMC meeting later this month. We continue to doubt that any additional detail will be provided at the FOMC, given the upcoming election.
August Manufacturing ISM Disappoints
August manufacturing ISM results were a miss and they could have been what the QE doctors had ordered. Higher costs due to higher prices, which we had touched on before, were clearly evident in the August report. The market has reacted negatively to this bad news, but the decline is somewhat contained as the possibility of a QE remains.
More disappointing news regarding the economy came out this morning. Construction spending for the month of July declined 0.9% from June, versus an expectation of a +0.5% increase.
US economic growth, if there is any, remains very sluggish. However, bad news such as the ISM report is met partially with optimism, as hopes for a QE remain strong. The S&P 500 is down only 0.5%. VIX is up nearly 8%. And that QE 'leading indicator', gold front month futures, is up around $8.
- ISM came in at 49.6, down from 49.8 in July and below our 50.1 estimate. The overall consensus was 50.0.
- The disappointing combination of sub-indexes that we saw in the July report worsened in August. Declines in new orders, production, and backlog,were accompanied by increase in inventories.
- Along with what appears to be lack of demand faced by manufacturers, their input prices increased significantly according to the prices sub-index.
- The only so-called bright spot in the report was a slight dip in customers' inventories. Some inventory replenishment could be in order, but that remains to be seen and is far from being an indication of consistent growth in demand.
More disappointing news regarding the economy came out this morning. Construction spending for the month of July declined 0.9% from June, versus an expectation of a +0.5% increase.
US economic growth, if there is any, remains very sluggish. However, bad news such as the ISM report is met partially with optimism, as hopes for a QE remain strong. The S&P 500 is down only 0.5%. VIX is up nearly 8%. And that QE 'leading indicator', gold front month futures, is up around $8.
Monday, September 3, 2012


Friday, August 31, 2012
What Came Out of Jackson Hole This Morning
On the backs of slightly disappointing Chicago PMI but
higher than expected University of Michigan's consumer sentiment survey,
Bernanke appeared to have disappointed the market with his speech at Jackson
Hole initially. When the speech was released, the S&P 500 dropped back down
to 1400, after popping up all the way to 1410 before the speech. Since then the market has moved back up with
S&P 500 now being up by approx. 8 points. VIX is down nearly 3%.
It appears that the market can continue to yearn for Bernanke's helping
hand, which it expects will be helping the market when the FOMC meeting takes
place in mid-Sept.
In short, Bernanke said that the Fed will not be ruling out
any option. But he also attempted to
limit expectations by saying that Fed's actions "cannot fine-tune the
economy". Bernanke also said
"monetary policy cannot neutralize fiscal and financial risks that the
country faces". The Fed's
'insurance coverage' of the financial market continues, inducing too much risk
taking and creating a central planning strategy in this so-called capitalistic
country.
Regarding this morning's economic indicators, the Chicago
PMI print of 53.0 was lower than the 53.8 consensus. It was also below July's 53.7. Increase in production, new orders and
employment sub-indexes, combined with lower inventories were positive. However, order backlogs and supplier
deliveries came in drastically lower than the prior month. The Chicago PMI results support our
manufacturing ISM estimate of 50.1. That
number will be released on Tuesday morning.
Lastly, University of Michigan consumer survey sentiment of
74.0 for August was higher than the 73.6 estimate, which was positive.
FB Price Target Lowered at BofA
Just thought to let you know that the great BofA/Merrill lowered its valuation of Facebook (FB) to $23/sh. This has been our valuation of the Company since the beginning. In addition, BMO Capital Markets lowered its price target on FB to $15/sh from $25/sh. FB is down nearly 4% while the entire market is flying high due to the upcoming Bernanke speech at 10am ET.
Thursday, August 30, 2012
Our Estimate of August Mfr. ISM
As everyone is waiting for Bernanke's magic words tomorrow from Jackson Hole, and given the upcoming 3-day weekend, we thought it is a good time to provide our guesstimate for the Aug. manufacturing ISM.
Our model generated an ISM of 50.1, a slight improvement from July's 49.8. We believe such a result will keep the Fed at bay as it does indicate some improvement, although it won't be something to write home about. We note that this figure is still significantly below the YTD high of 54.8 that we saw in April. It is also below last year's 52.5 and 2010's 57.4. Manufacturing ISM for August will be released on Tuesday, 9/4, at 10am ET.
The market could be begging Bernanke to make some pro-QE comments at Jackson Hole, as it has reacted negatively to initial jobless claims and personal income & spending economic data. Even with today's near 1% decline, and if those losses are not pared by the close, we think a QE is more than priced in. S&P 500 is down nearly 11 points, but VIX is up only around 3.5%.
We will provide our estimate of August nonfarm payrolls (NFP) this weekend.
Initial Jobless Claims & July Personal Spending Disappoint
Last week's initial jobless claims and personal spending in July were both disappointing. However, the data, we believe, was not bad enough to nudge the Fed to launch another QE. The market also indicates this at least in early trading as the S&P 500 is down approx. 7 points.
Initial Jobless Claims
It appears that for once we were too optimistic. Even with a higher seasonal factor applied to last week's non-adjusted initial jobless claims (as compared with prior years), the print exceeded expectations; 374K versus 370K consensus. The upward revision of prior week's data continued with another 2K increase to 374K. The 4-week moving average, which unfortunately has been 'trending up', came in above 370K.
Personal Spending & Income
July personal spending inched up 0.4% over the prior month. However, this was below the Street's 0.5% expectation. In addition, spending growth in June was revised down 20bps to 0.3%. Personal income and PCE price index were in-line; 0.3% and 0.0%, respectively. Savings as a percentage of disposable income was down 10bps to 4.2%, which may be good news for spending in Aug. We expect to see a sizable increase in the PCE price index for August given the recent spike in oil futures, and gasoline and food prices.
Although the market is down currently, there are indications that it continues to yearn for more help from the Fed as gold remains in positive territory and VIX is up only around 2% after the bad economic news.
Wednesday, August 29, 2012
July Pending Home Sales Up 2.4%
As we suggested yesterday, July pending home sales surprised to the upside. The monthly change came in at 2.4%, significantly above the no change consensus. We note that the 2.4% figure is seasonally adjusted. In addition, while the Y/Y change was positive for all regions, the West experienced a slight m/m decline, -1.7%. The NAR blames this on limited inventory. The non-seasonally adjusted numbers were a different story as three of the four regions saw a m/m decline, with Northeast 'leading the way' with -20.6%. However, similar to the seasonally adjusted figures, there was a Y/Y increase in pending home sales within every region. XHB is up 0.6% but hasn't yet gone above its 52-week high of 23.59.
Overall, the market is pretty much flat with S&P 500 up one point. It appears that the GDP and pending home sales numbers were too good, which means it is less likely for the Fed to launch a QE this year or even give the market some hint on Friday at the Jackson Hole meeting.
Subscribe to:
Posts (Atom)